


COVID-19 Forecast for El Paso County — Dec. 28
Plus, a University of Colorado data scientist on researching the coronavirus
Good morning, and congratulations for almost making it to the end of 2020. On this pre-pandemic date in 2019, Colorado College’s men’s hockey team lost two to five in their last game of the calendar year against Dartmouth College. (This semester, CC’s ice hockey players started their season in a pod of other college hockey teams after finishing a 14-day quarantine when one of their players tested positive for the coronavirus.)
Today, Phoebe Lostroh returns to give her weekly COVID-19 forecast for El Paso County and to explain Colorado’s latest guidelines for businesses operating under coronavirus restrictions. Lostroh is a professor of molecular biology at Colorado College on scholarly leave who is serving as the program director in Genetic Mechanisms, Molecular and Cellular Biosciences at the National Science Foundation.
The Q-and-A section of today’s newsletter features Kyle Bartsch, who graduated from Colorado College in 2006 with a degree in biology. During the pandemic, Bartsch has been a lead developer of the University of Colorado Anschutz Medical Campus’ COVIDome Explorer, a dataset about COVID-19 patients available for use by medical researchers.
Phoebe’s Forecasts
NOTES: These forecasts represent her own opinion and not necessarily those of the National Science Foundation or Colorado College. She used the public El Paso County dashboard for all data. Lostroh prepared these forecasts on Dec. 26, 2020.
⚖️ How her predictions last week shaped up: Dec. 26 is the last day of Morbidity and Mortality Weekly Report week 52 in the national public health calendar. It is the 42nd week since the first case was detected in El Paso County, Colorado. Since March 13, 524 El Paso County residents have died of COVID-19. Last week, Lostroh predicted about 1,912-2,484 new cases during the week ending Dec. 24. There were actually 2,133 cases.
Cumulative reported COVID-19 cases in El Paso County with predictions
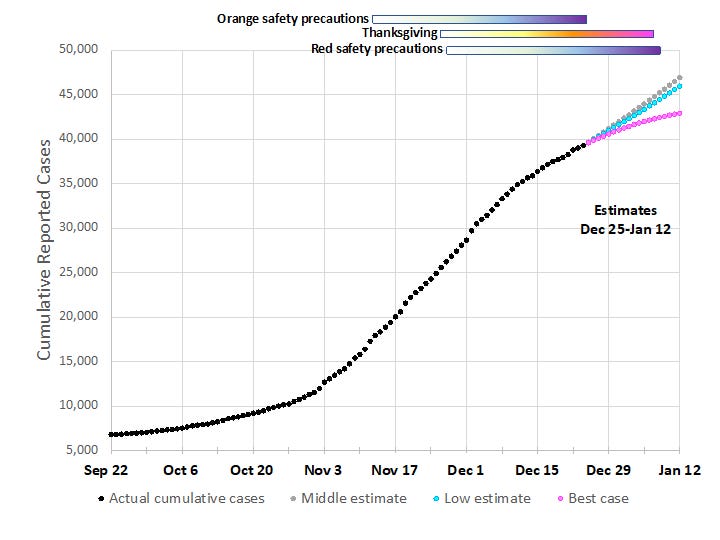
🗝️ Key points: Reported cases are in black circles while the other symbols provide estimates based on curve-fitting. The middle and low estimates are from exponential fits to the last 14 and seven days, respectively, while the best case is a linear fit based on data from the past 14 days. Horizontal boxes filled with a gradient from white to purple indicate the six weeks following an event that might reduce spread, such as the implementation of Level Orange or Red safety precautions, and boxes with a gradient from white to pink show the six weeks after an event that might increase spread, such as Thanksgiving gatherings.
“The rate of new cases is still declining, but it is not going down as fast as it was last week,” Lostroh said. Depending on if the decline in incidence continues as it has for the past two weeks or if the virus resumes exponential spread, Lostroh predicts El Paso County will see between 1,738-2,327 new cases for the week ending Dec. 31.
Rolling 14-day COVID-19 incidence per 100,000 people with predictions

🗝️ Key points: The actual calculated incidence is in black X’s, while the other symbols provide estimates based on curve-fitting as in the first graph. As of Dec. 27, the 14-day rolling incidence per 100,000 people was 587 and decreasing. Lostroh said that while there has been a two-week sustained decline in incidence per 100,000 people in El Paso County, the incidence is still significantly higher for the 350-person threshold for Level Red restrictions.
COVID-19 hospitalizations and deaths in El Paso County

🗝️ Key points: Cumulative hospitalizations from COVID-19 are plotted on the left in red while cumulative deaths are plotted on the right in black. Lostroh said that the most recent reliable data for new hospitalizations in El Paso County are from Dec. 22, while the most recent reliable death data are from Dec. 20. As of Dec. 23, the regional hospital census for COVID-19 inpatients in El Paso County was 182 people. “The pace of new hospitalizations is lower than it was a month ago, but the pace of deaths remains elevated,” Lostroh said.
Since Halloween, more than 1,045 people have been hospitalized in El Paso County due to COVID-19, and around 321 people have died from the virus, Lostroh said, adding that at least 228 of those people died between Thanksgiving and Christmas Eve. There is typically a 15% death rate among Americans hospitalized with the coronavirus, and one study in Michigan found an additional 7% of hospitalized COVID patients died in the months following their discharge.
👀 New COVID restriction program for Colorado businesses
Despite some health officials voicing concern about people “letting down their guard” as coronavirus conditions improve across Colorado, earlier this month state officials finalized guidelines for a new five star certified business variance program. The optional program allows businesses to expand their indoor capacity caps if they implement additional COVID-19 safety measures beyond what is already required by public health guidelines.
For example, certified businesses in a Level Orange county can operate under guidelines for the level below, Level Yellow. Red-level counties are only eligible for the program if they’ve seen a two-week sustained decline in incidence and hospitalizations and a decreasing positivity rate of under 10%. If a county reaches Level Purple, they become ineligible.
In a letter published by media outlets on Dec. 21, El Paso County officials, including the mayor and city council president of Colorado Springs, wrote to Gov. Jared Polis asking for a modification of the state’s five star certification program.
The letter, citing the program’s “unnecessary cost and administrative burden to businesses,” asked that the public health order be modified so that El Paso County restaurants could immediately re-open indoor dining at 25% capacity with a maximum of two households per table, and for capacity to be increased to 50% if incidence decline continues for two weeks. Currently, all indoor dining in the county is closed under Level Red restrictions.
The five star variance program as it stands now says that if El Paso County stays at Level Red, participating businesses could operate under Level Orange restrictions of 25% indoor dining capacity. If the county moves to orange, participating businesses could operate at Level Yellow’s 50% indoor dining capacity. For yellow-level restrictions, the coronavirus incidence per 100,000 people is between 75-175 cases, and is 175-350 cases for Level Orange. As of Dec. 27, the 14-day incidence in El Paso County is 587 cases per 100,000 people.
As of Dec. 27, Gov. Polis has not publicly responded to this letter.
Today’s Q-and-A: Kyle Bartsch ’06 on his coronavirus research with the University of Colorado
Kyle Bartsch is currently a Data Specialist and Analyst at the University of Colorado School of Medicine’s Anschutz Medical Campus. Bartsch majored in biology and graduated from Colorado College in 2006 before completing his MBA in 2015 and his M.S. in 2016 at the University of Colorado Denver. This interview has been edited for length and clarity. Bartsch’s responses represent his own opinions and not necessarily those of his employer.
CC COVID-19 Reporting Project: How is biomedical research on COVID-19 conducted at the Anschutz Medical Campus, and what is your involvement in that research?
Bartsch: The Anschutz campus is a special place because it’s this giant campus just dedicated to biomedical research across the board. You have UCHealth, which is the major hospital right there on campus, you have Children’s Hospital, and then you have the actual medical campus, which is cancer research, it’s bio research, it’s the School of Medicine, it’s the School of Public Health, it’s the School of Dentistry — so they’re all there. In March, when the pandemic really started to ramp up, a whole bunch of different labs at the school wanted to get involved and start doing some research on biospecimens coming out of patients that were being hospitalized at UCHealth for COVID-19. In other times, when it’s not just everyone focused on COVID-19, all these different labs specialize in their own particular disease, or a particular manifestation of molecular physiological disease. This time we had someone within the university, Thomas Flaig, who is the vice chancellor of research, who said ‘hey, we all want to do the same kind of research. We all need to get biospecimens in order to be able to do that research, so why don’t we draw one sample per participant and then let people do all the research on it downstream?’ So we created this thing called the COVID-19 biobank. There’s a process involved in getting people to consent to the program and say we can draw some of their blood and other specimens and do research associated with that. We consented about 105 participants to participate in the study, and it’s a mix of people that did actually have COVID-19, and some that didn’t. Those biospecimens got processed at a central level for the biobank. And then — this is what is so cool about this project — all these different disparate labs coordinated together in this collaboration that they’re calling the COVIDome, and conducted research in a concerted way to generate datasets across all these different slices of biomedical research against COVID-19. So it was this really large collaborative effort between multiple labs and multiple people across the board. The portion that I’m most involved in is helping them take some of the data they generate from that research and share it via this online tool to do additional hypothesis testing and analytics. And that’s the COVIDome Explorer.
CCRP: The mission of the COVIDome Project describes a commitment to following the principles of open science. To what extent does the Anschutz Medical Campus plan to share its research and collaborate with outside laboratories?
Bartsch: This is very much built in the name of open science and trying to bring in collaborators external to the Anschutz campus. We want to have people come in and say ‘hey, I know about X, Y, or Z. You guys are seeing findings along these lines, and I really am interested in seeing what your data says about this particular thing — how do we collaborate?’ There have been multiple inquiries with people doing research on this particular cytokine, for example, asking to compare data with us. I’ve seen people from Oregon reach out, people from the Washington D.C. area, they had someone from Germany reach out for collaboration, and someone from Brazil. I know that one of our larger goals is that this can be a platform we can use as a basis to talk about our research and collaborate. One of our next steps on this is to make available more of the personalized data that’s in there, which would still be obfuscated and anonymized, but would get you a little bit more detail on a participant-by-participant level. The idea would be that you can get in there and start to see some of those nuances, then also be able to reach out to the corresponding team. And as long as you are able to sign some of the non-disclosures and all that, you could actually get to some of the raw data.
CCRP: In your opinion, what are some of the challenges associated with using public COVID-19 dashboards to share important statistics with a community?
Bartsch: Data is never 100% complete. There’s always interpretation in regards to data, and that will always be a challenge. COVID-based dashboards overall present a big challenge right now with trying to communicate data to the public. One of the issues that I see on a daily basis is just differences in the way that data is being reported out on a county-by-county or municipality-by-municipality level. I know for a fact that some counties will report their case counts or their incidences by test dates as opposed to by report date. So you’ll end up with discrepancies from the state-level reporting of a particular county versus the county themselves because they’re reporting based on different dates. I think it’s really tough right now, specifically, to communicate some of that data and then also be able to say that there’s always nuance, and there’s always interpretation that needs to be taken with it. It’s hard, especially when you find that data gets revised quite a bit. I think it can shake some confidence in people when they are going to those dashboards and trying to make decisions from them. When it’s constantly shifting, that becomes problematic.
About the CC COVID-19 Reporting Project
The CC COVID-19 Reporting Project is created by Colorado College student journalists Isabel Hicks, Esteban Candelaria, Lorea Zabaleta, and Cameron Howell in partnership with The Catalyst, Colorado College’s student newspaper. Work by Phoebe Lostroh, Associate Professor of Molecular Biology at CC and National Science Foundation Program Director in Genetic Mechanisms, Molecular and Cellular Biosciences, will appear from time to time, as will infographics by Colorado College students Rana Abdu, Aleesa Chua, Sara Dixon, Jia Mei, and Lindsey Smith.
The project seeks to provide frequent updates about CC and other higher education institutions during the pandemic by providing original reporting, analysis, interviews with campus leaders, and context about what state and national headlines mean for the CC community.
📬 Enter your email address to subscribe and get the newsletter in your inbox each time it comes out. You can reach us with questions, feedback, or news tips by emailing ccreportingproject@gmail.com.